Please note the following for the /NET version:
- The ControlID and License properties have no effect. The ControlID property always returns the type name of the object set by the Object property, while the License property always returns an empty string.
- call Object property to specify the eXGraph/NET object to customize the view of the pivot-table, as ExPivot1.CustomView.Object = Exgraph1, where Expivot1 and Exgraph1 are instances of exontrol.EXPIVOTLib.expivot and exontrol.EXGRAPHLib.exgraph placed within the same form.
The following code, shows how you can enable the control's graph capabilities using the eXGraph control. The code also demonstrates how you can use IntelliSense for the internally created control.
Private g As EXGRAPHLib.Graph

Private Sub Form_Load()
    With Pivot1.CustomView
        .ControlID = "exontrol.graph"
        Set g = .Object
        With g
            .SerieType = "area"
            .AutoFit = True
        End With
    End With
End Sub
To define the EXGRAPHLib.Graph type, you need to include a reference to the eXGraph control. This can be done by going to Project > References, then selecting "ExGraph 1.0 Control Library".
The following code changes the direction and style of the displayed series (once the ViewChange event occurs):
Private Sub Pivot1_ViewChange()
    With g
        .BeginUpdate
        .MultiColorSerie = .SerieType = "Pie"
        With .Series
            For i = 0 To .Count - 1
                .Item(i).Vertical = True
                .Item(i).Style = exSpline
            Next
        End With
        .EndUpdate
    End With
End Sub
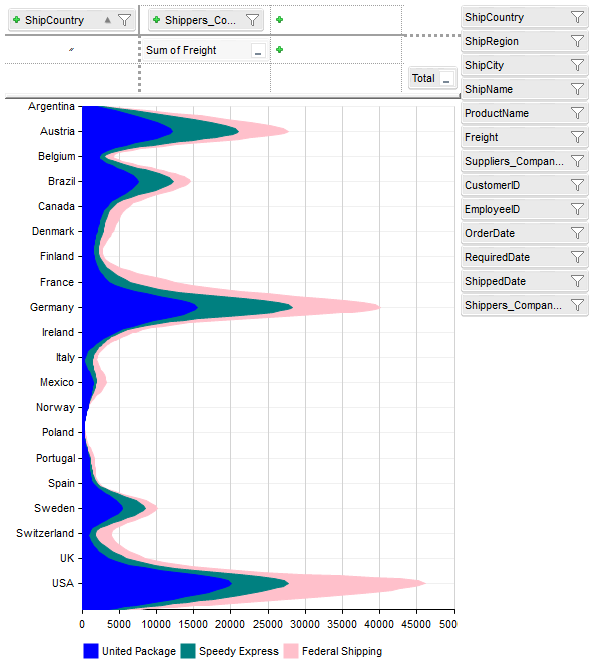
The following screenshot shows the result of the code: