property Chart.ColumnsTransparent as Long
Specifies the percent of the transparency to display the columns in the chart.

TypeDescription
Long A Long expression, from 0 to 100, that indicates the percent of transparency that's used to paint the columns in the chart part of the control. 0 means opaque, 100 means hidden, or 100% transparent. 50 means semi-transparent.
By default, the ColumnsTransparent property is 0. Use the ColumnsFormatLevel property to specify the columns to be displayed on the chart's section. For instance, the ColumnsFormatLevel = "0" displays the first column ( the column with the index 0 ), on the chart. The ColumnsFont property indicates the font to be used when showing the columns on the chart part of the control. The ShowTransparentBars property to specify a transparency to displays all bars in the chart. The ColumnsFormatLevel property may display any visible or hidden column. The Visible property indicates whether a column is visible or hidden in the items section. 

The following screen shot shows the a check-box column in the right side of the chart, using a semi-transparent color:
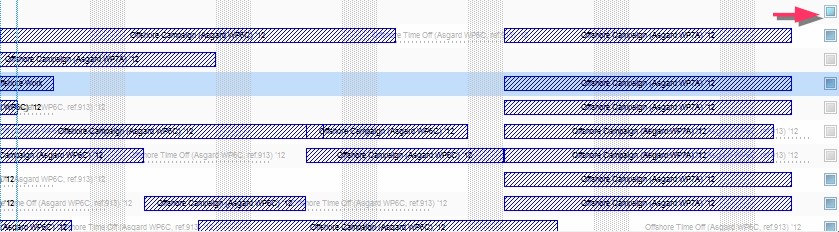