Use the InsideZooms property to access the inside zoom units.
Beside inside zooming, your application can provide the following options to help user while performing moving or resizing the bars at runtime:
- grid lines, that can be shown only when moving or resizing, using the ChartStartChanging and ChartEndChanging events, or all the time
- select date, to specify the margins of the area you want to highlight
- ticker, that shows the cursor's position in the chart, or while resizing, it shows exactly the size and the position of the bar, including starting and ending date.
- ability to specify a resizing/moving unit, different that the displayed one ie while the chart displays days, you can specify the resizing unit on hours.
The following chart displays days:
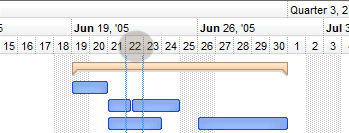
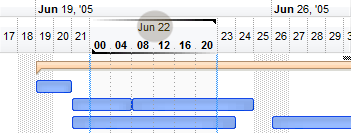
The Jun 22, gets magnified to hours so it looks like follows ( the first line displays the day, while the second displays the hours, the rest of the chart displays days ):
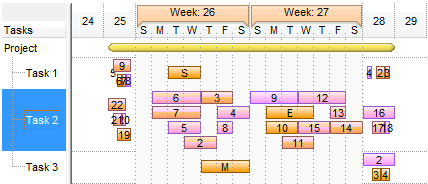
The chart displays weeks:
while the week 26 and 27 gets magnified to days it looks like follows ( the first line displays the week number, while the second line displays days, the rest of the chart displays weeks ):
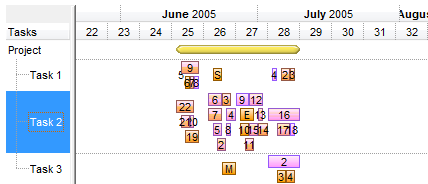
The following animation shows resizing the bars, using the inside zoom feature: