

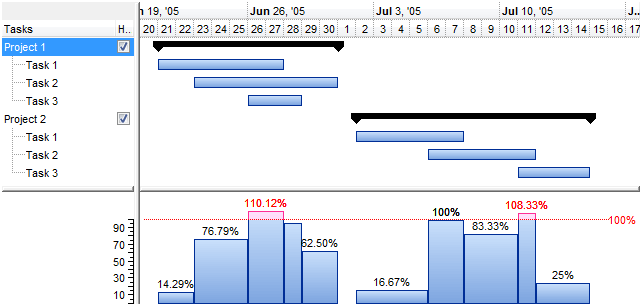
The following screen shows values in a exHistOverLoad histogram (ShowHistogramValues property is "value>100?255:1"):
The following screen shows values in a exHistOverAllocation histogram ( ShowHistogramValues property is "value>=5?16711680:255"):
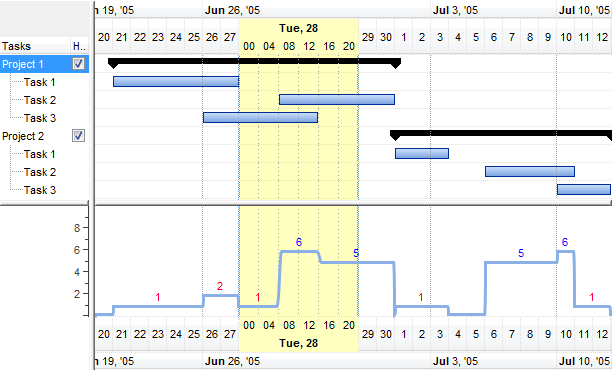
The value keyword in ShowHistogramValues property indicates the value in the histogram
This property/method supports predefined constants and operators/functions as described here.