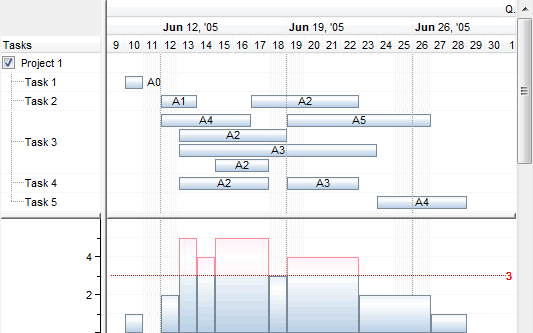
The following screen shot shows the critical part when HistogramType property is exHistOverload, and the HistogramCriticalValue property is 3. The bars over value 3 gets colored in red. The grid lines are shown and the ruler shows the count of the bars.
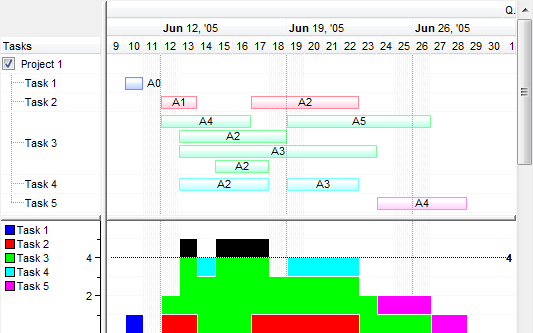
The following screen shot shows the critical part when HistogramType property is exHistOverload + exHistCumulative, and the HistogramCriticalValue property is 4. The bars over value 4 gets colored in black. The grid lines are shown and the ruler shows the count of the bars and the legend of the bars being colored.
The following screen shot shows the critical part when HistogramType property is exHistOverallocation, and the HistogramCriticalValue property is 100%. The bars over 100% gets colored in red. The grid lines are NOT shown and the ruler shows the percents.

The following screen shot shows how the histogram curve is changed once the user resizes or moves bars ( in this case the HistogramType property is exHistOverAllocation )